🚀 Overview
What is AI@Flows?
AI@Flows – Interface Review Workbench gives SAP project teams one place to understand the interface landscape of an SAP ECC system and to measure and track the adaptation of every interface to the new SAP S/4HANA systems.
During an S/4HANA conversion, interfaces are among the hardest objects to keep under control: they are spread over IDocs, RFCs, web services, files and manual uploads; they depend on custom code that may or may not still run; and each one has to be rebuilt, re-configured and tested in every system of the new landscape. AI@Flows combines, for each interface:
- the interface analysis of the source ECC system: flows, SAP objects, business rules, traces, evidence and open questions
- its usage in production, measured with SCMON
- the ATC findings (P1–P3) on the custom objects it uses
- the implementation reports of each target S/4HANA system and cycle
- the review comments of the application owners and the system integrator, which flow back to the AI application
- the sign-off by the Integration Lead and the Functional Lead
The workbench is a single HTML file: no server, no installation, and no data inside the app. It runs in Microsoft Edge or Google Chrome and reads all data from three project folders.
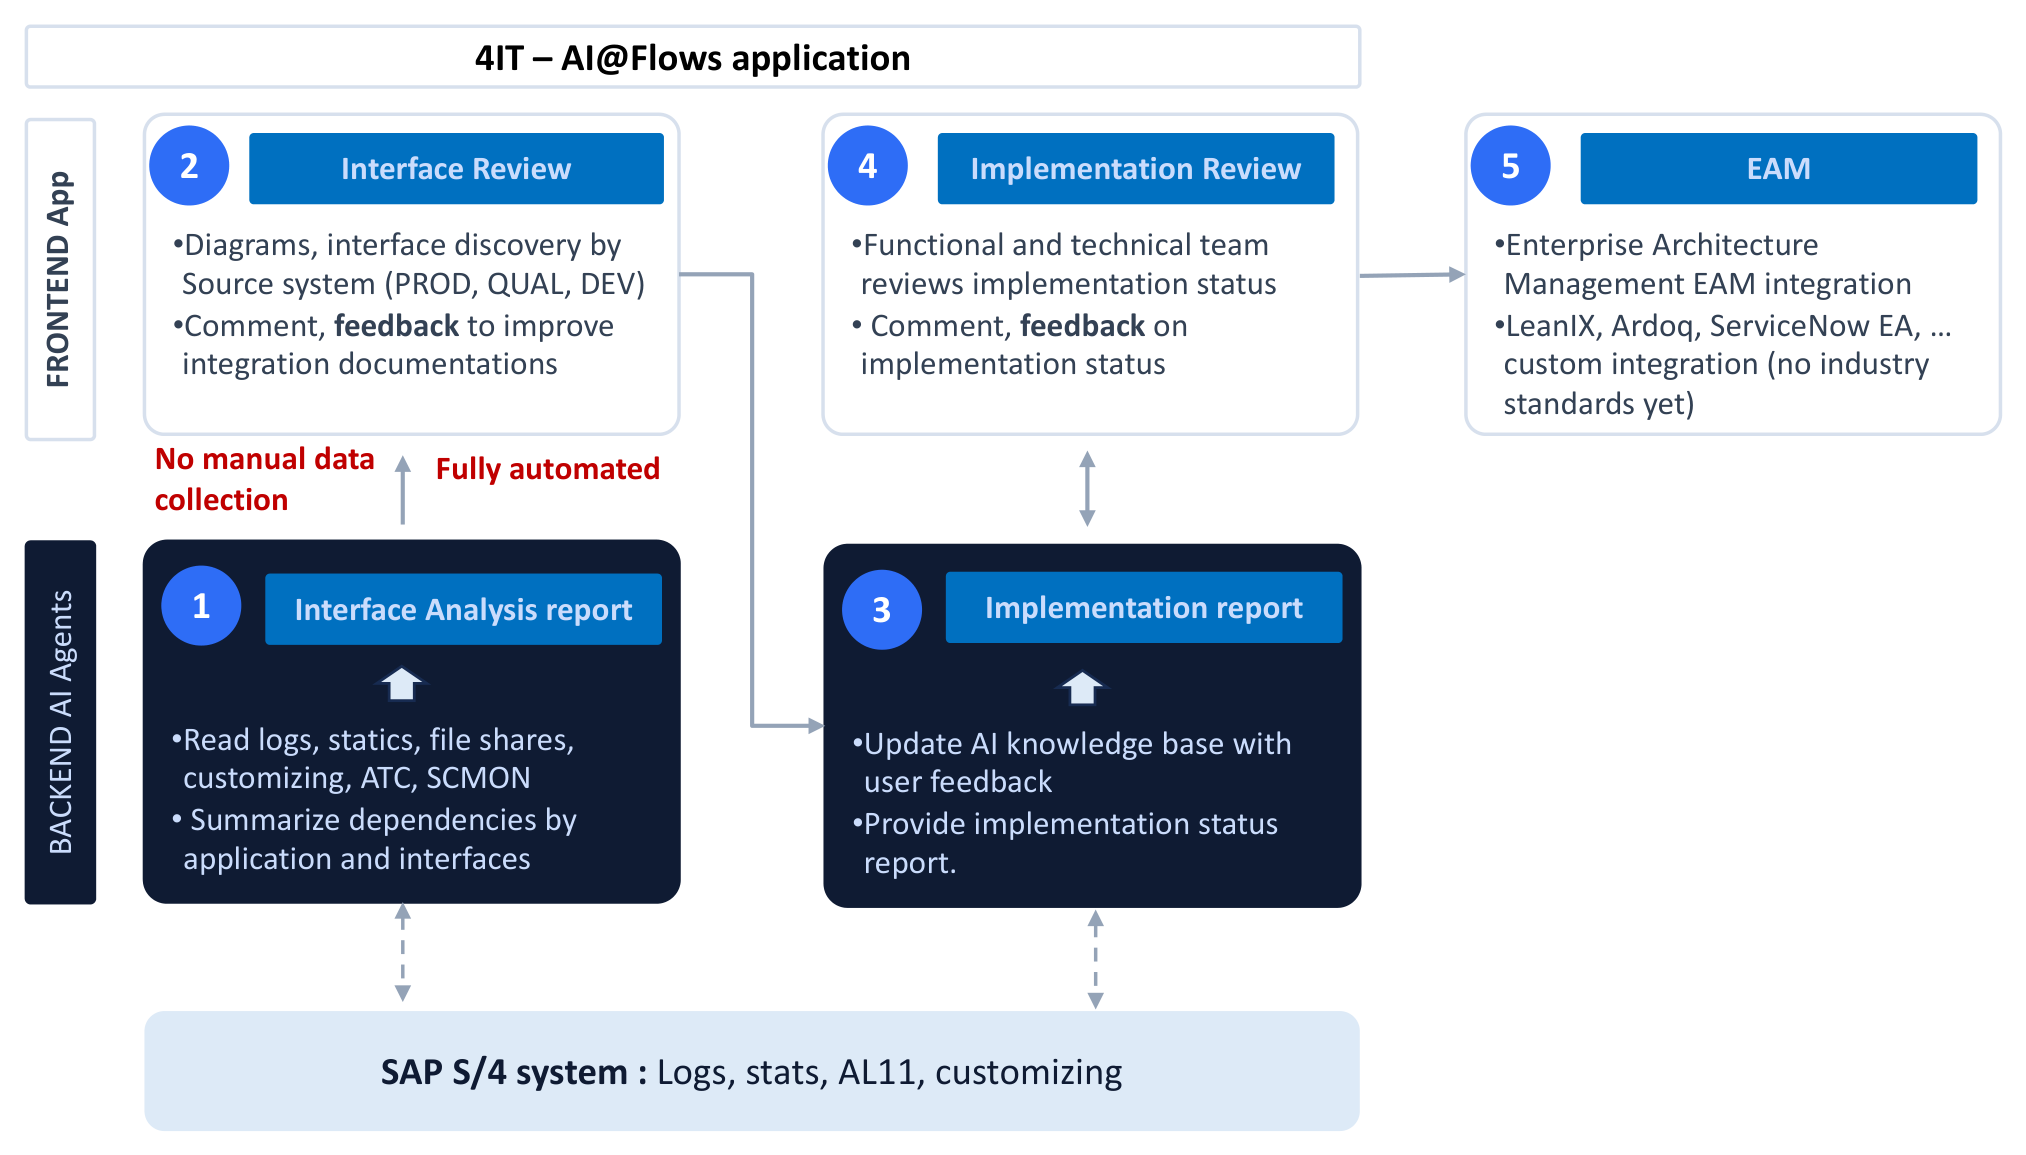
The picture below shows the whole loop. The backend AI agents (dark boxes) read the logs, statistics, file shares, customizing, ATC and SCMON data of the SAP system and summarise the dependencies by application and interface in the Interface Analysis report (1) — no manual data collection. In the frontend app, the team discovers the interfaces of each source system with diagrams and comments on them to improve the documentation (2). The agents feed this feedback into their knowledge base and report the implementation status in each target system (3), which the functional and technical team reviews and comments on in turn (4). In a later step, the results can be passed to an Enterprise Architecture Management tool such as LeanIX, Ardoq or ServiceNow EA (5), through a custom integration as there is no industry standard yet.
How It Works
Step 1 — Interface Analysis of the Source System
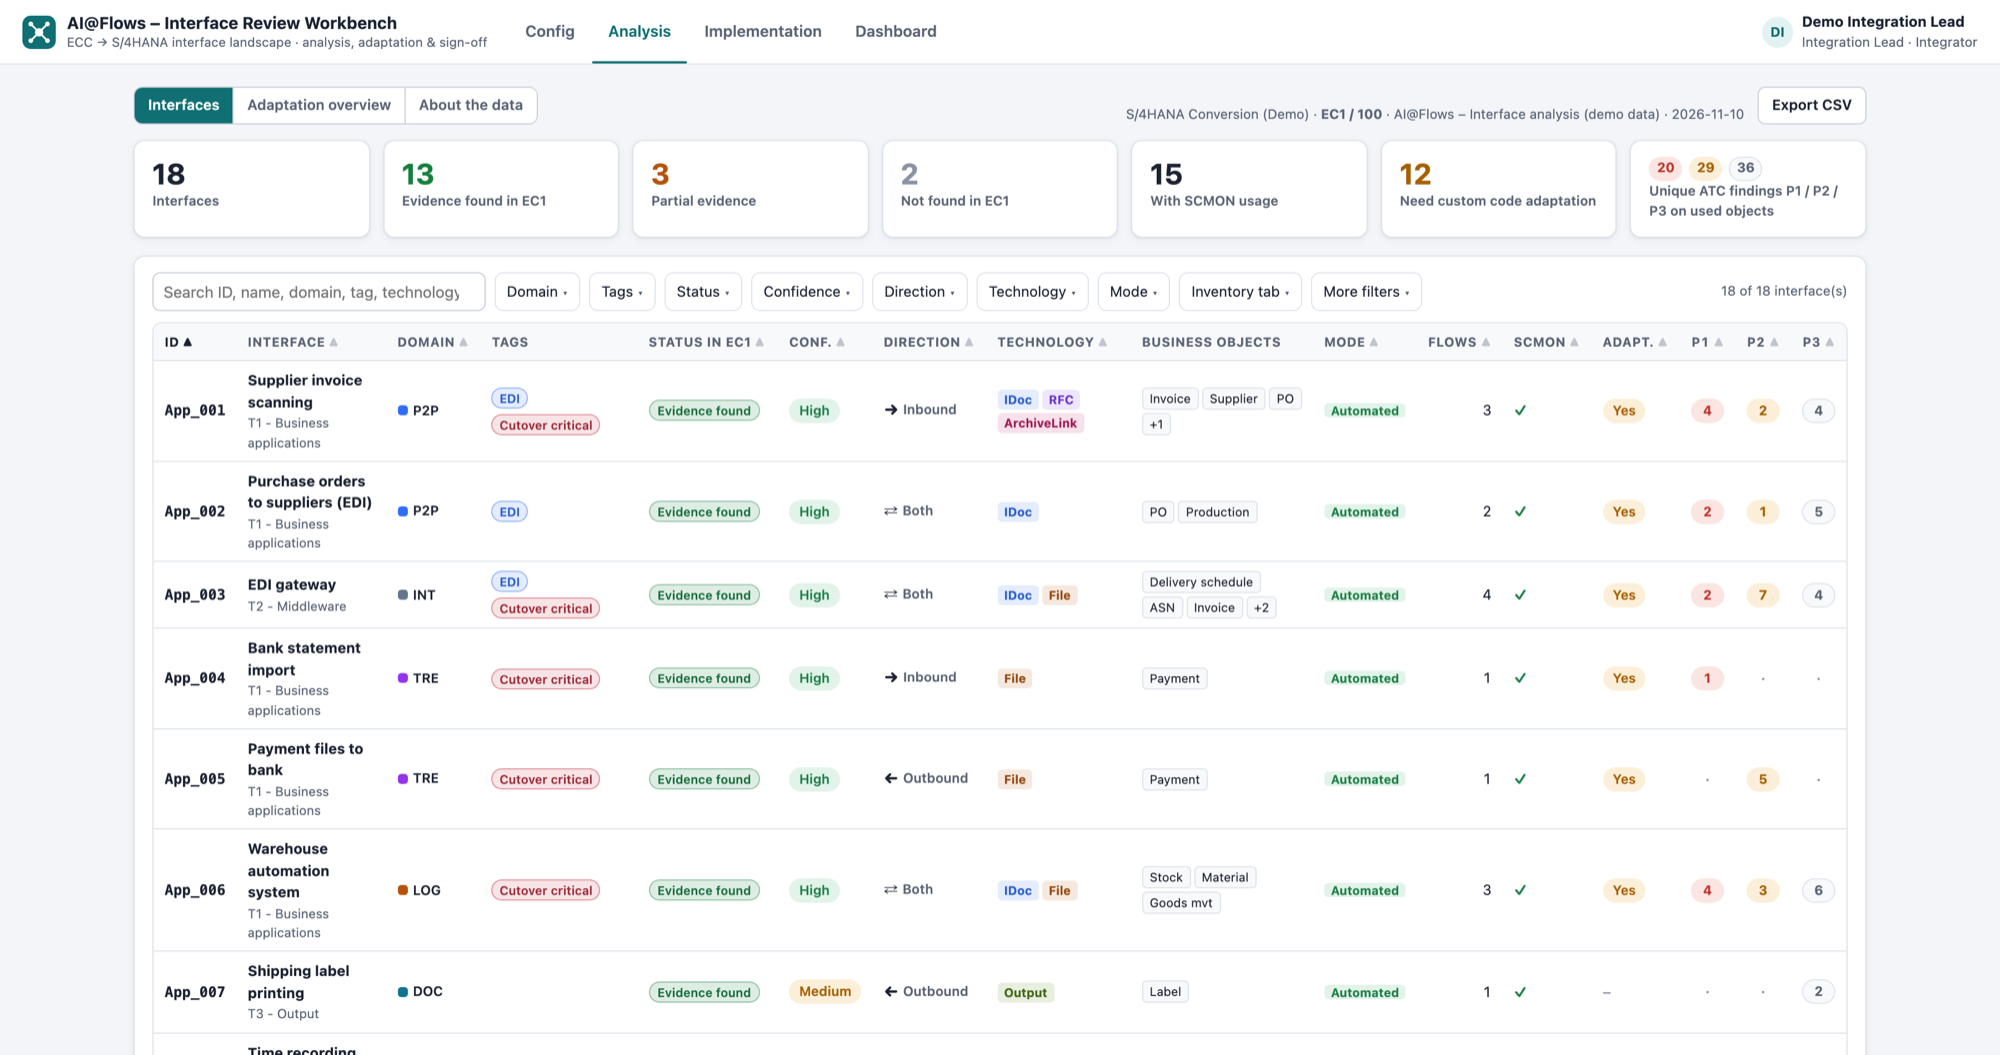
Every interface of the inventory is analysed in the ECC system. The analysis file records, per interface, whether evidence was found, the flows with direction, technology and volume, the SAP objects involved (RFC destinations, IDoc ports, partner profiles, programs, jobs…), business rules, traces, reusable evidence data, S/4HANA migration points and open questions.
In the workbench this is the Analysis page: an interface list with KPIs and filters, and a detail page per interface. There is one analysis file per analysed system; the System selector switches between them.
Step 2 — Focus on the Code that Really Runs
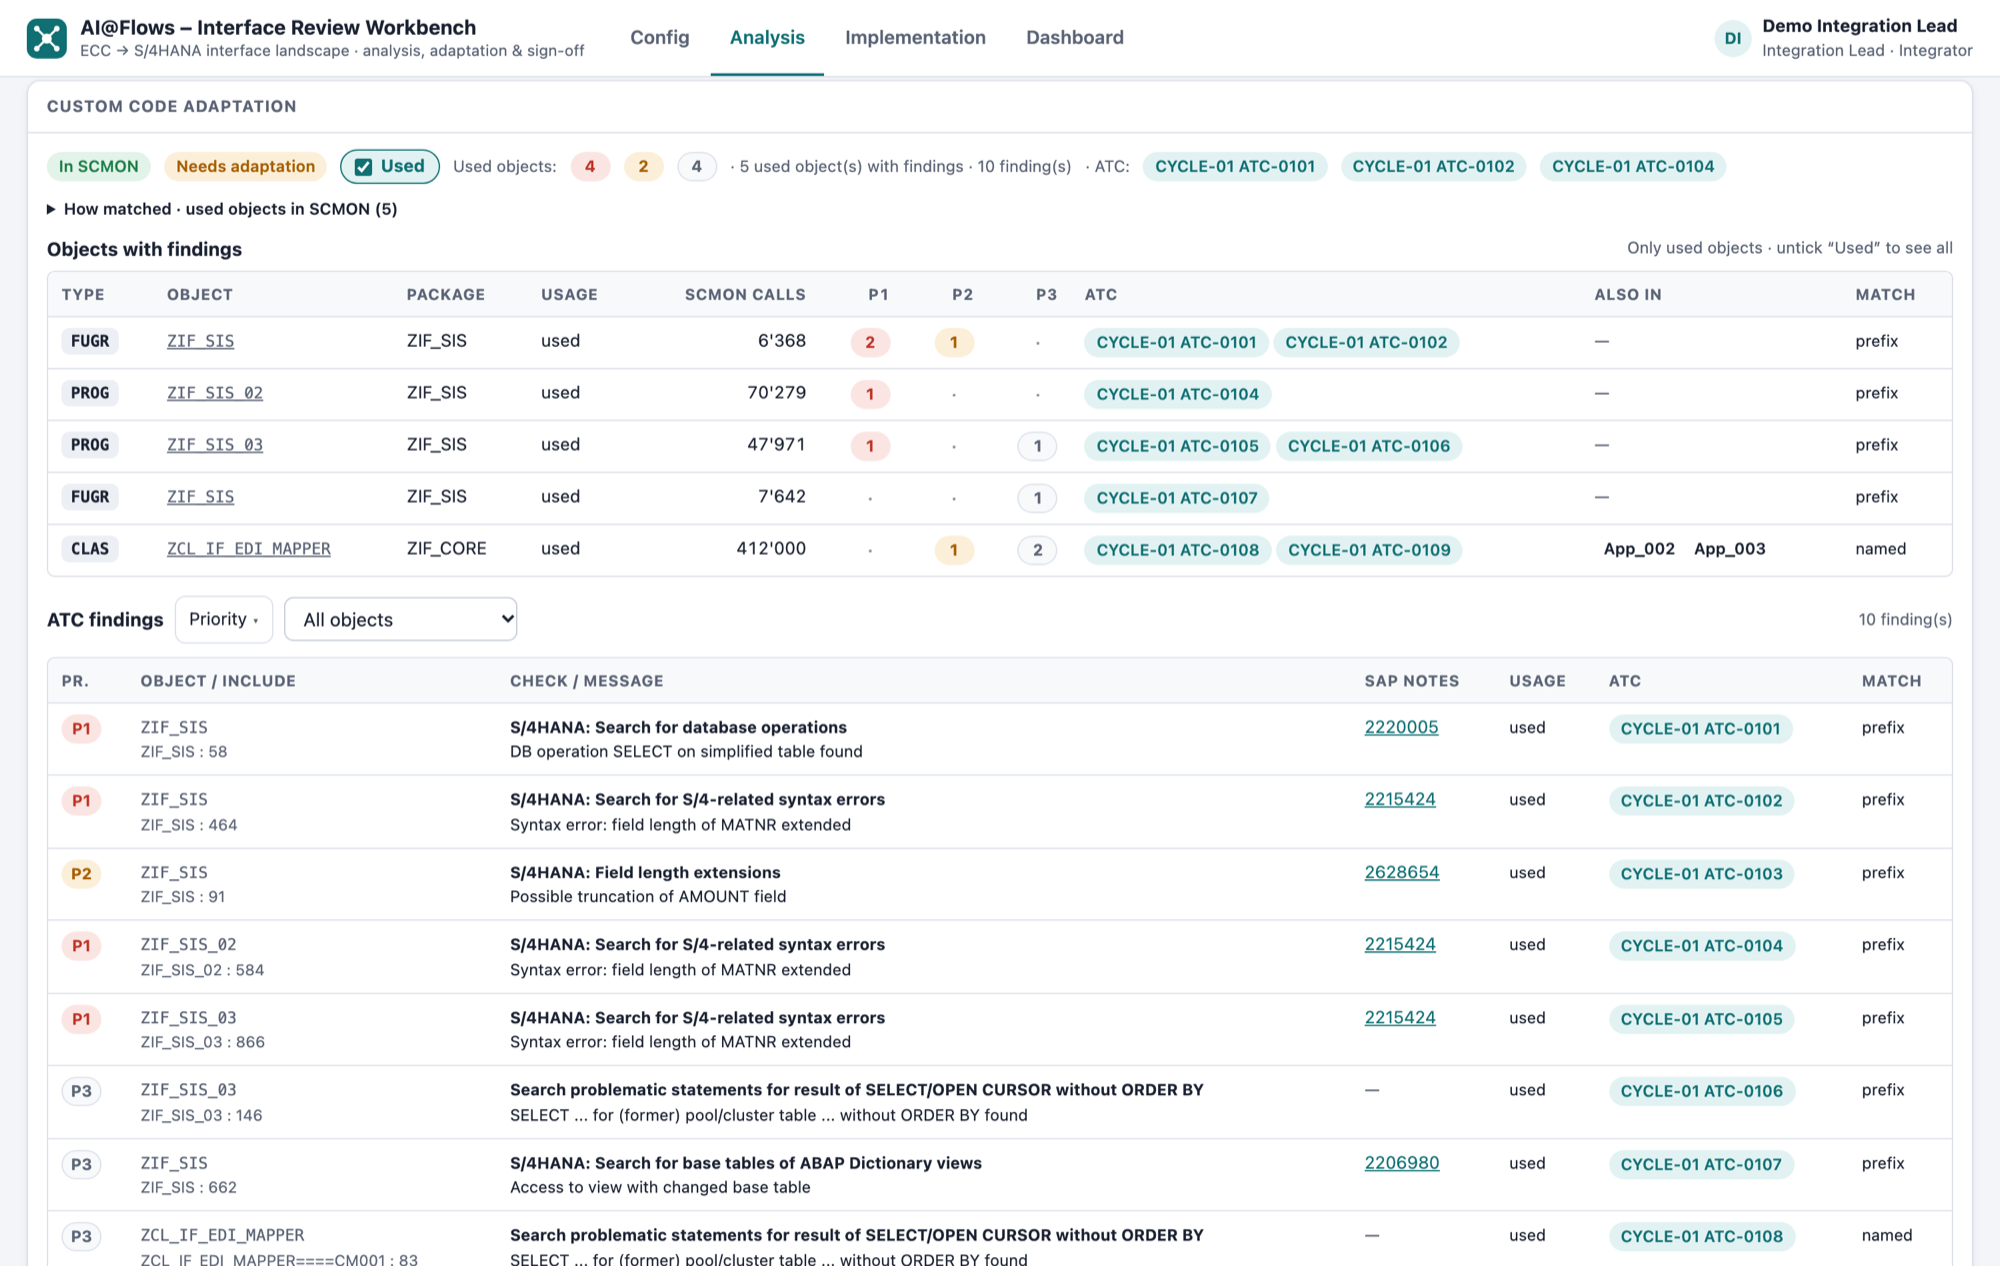
Not every custom object flagged by ATC matters. AI@Flows links each interface to its custom objects and keeps only the findings on objects used in production (SCMON calls > 0). The P1–P3 figures, the Custom code section of each interface and the Adaptation overview all use this rule, and show which objects are shared between interfaces so they are adapted once.
Step 3 — Implementation in Each Target System
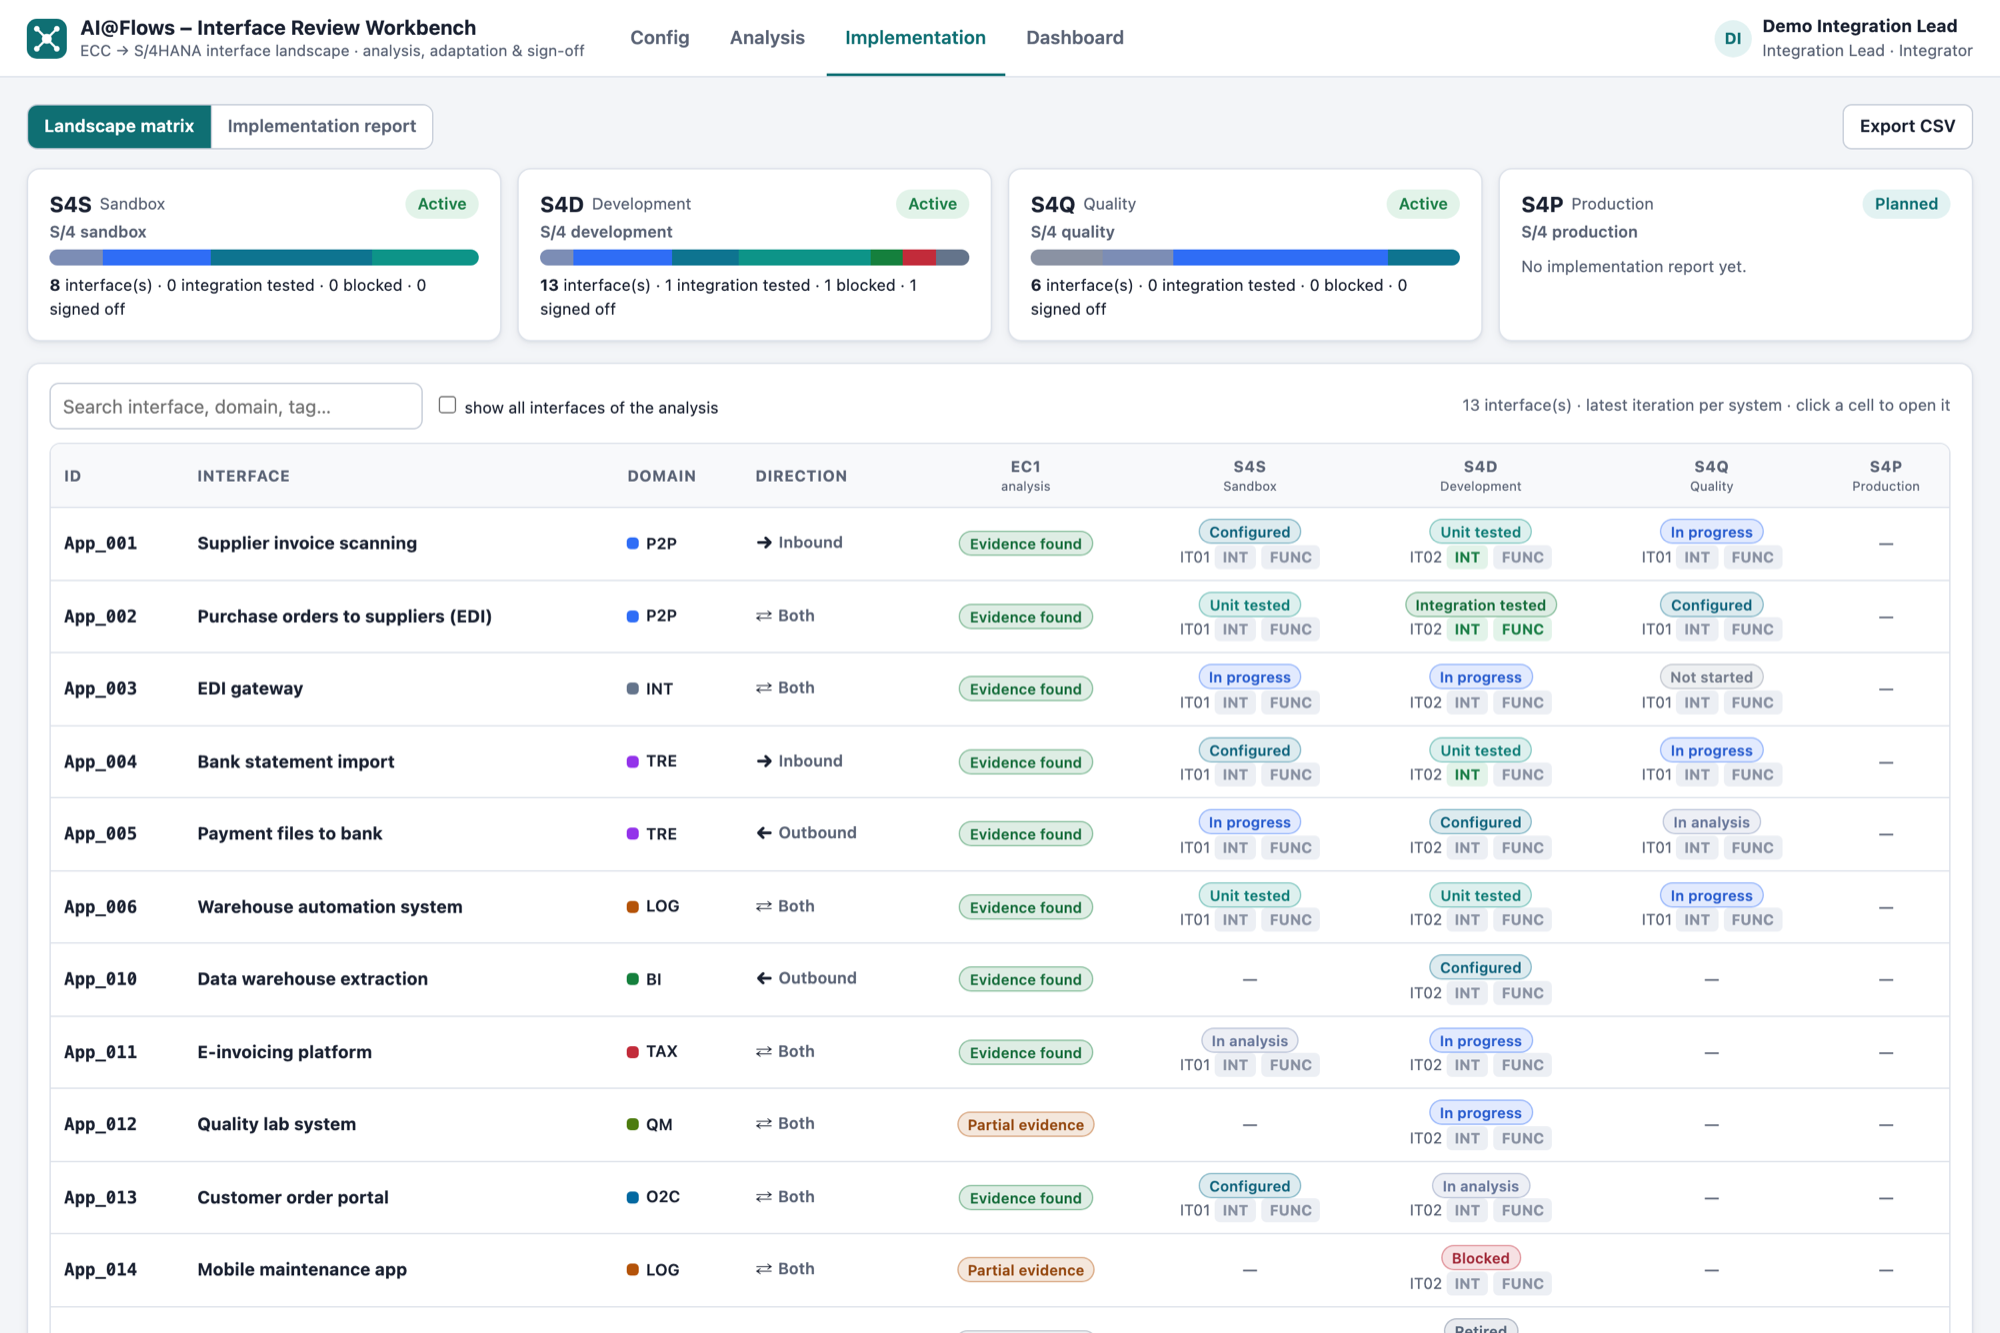
For each target system (Sandbox, Development, Quality, Dry-run, Production) and cycle, an implementation report records the status of every interface: as-is → to-be flows, configuration, custom code, transports, tests and issues. The configuration trace shows each configuration item side by side from the source system through every target system.
This is the Implementation page, with a landscape matrix of interfaces × systems.
Step 4 — Review Comments and Sign-off
Application owners and the system integrator add review comments on the interface sheets of the analysis and on the implementation of each system and cycle. Comments are collected in review rounds; a closed round goes back to the AI application, which corrects the analysis or the implementation report, carries open points into the next cycle and learns from the feedback (customer knowledge base and general best practices). Its answer is shown under each comment.
Separately, each interface in each target system is signed off per cycle by the Integration Lead and the Functional Lead: Approved, With reserves or Rejected, with a mandatory comment unless approved.
Step 5 — Application Diagram
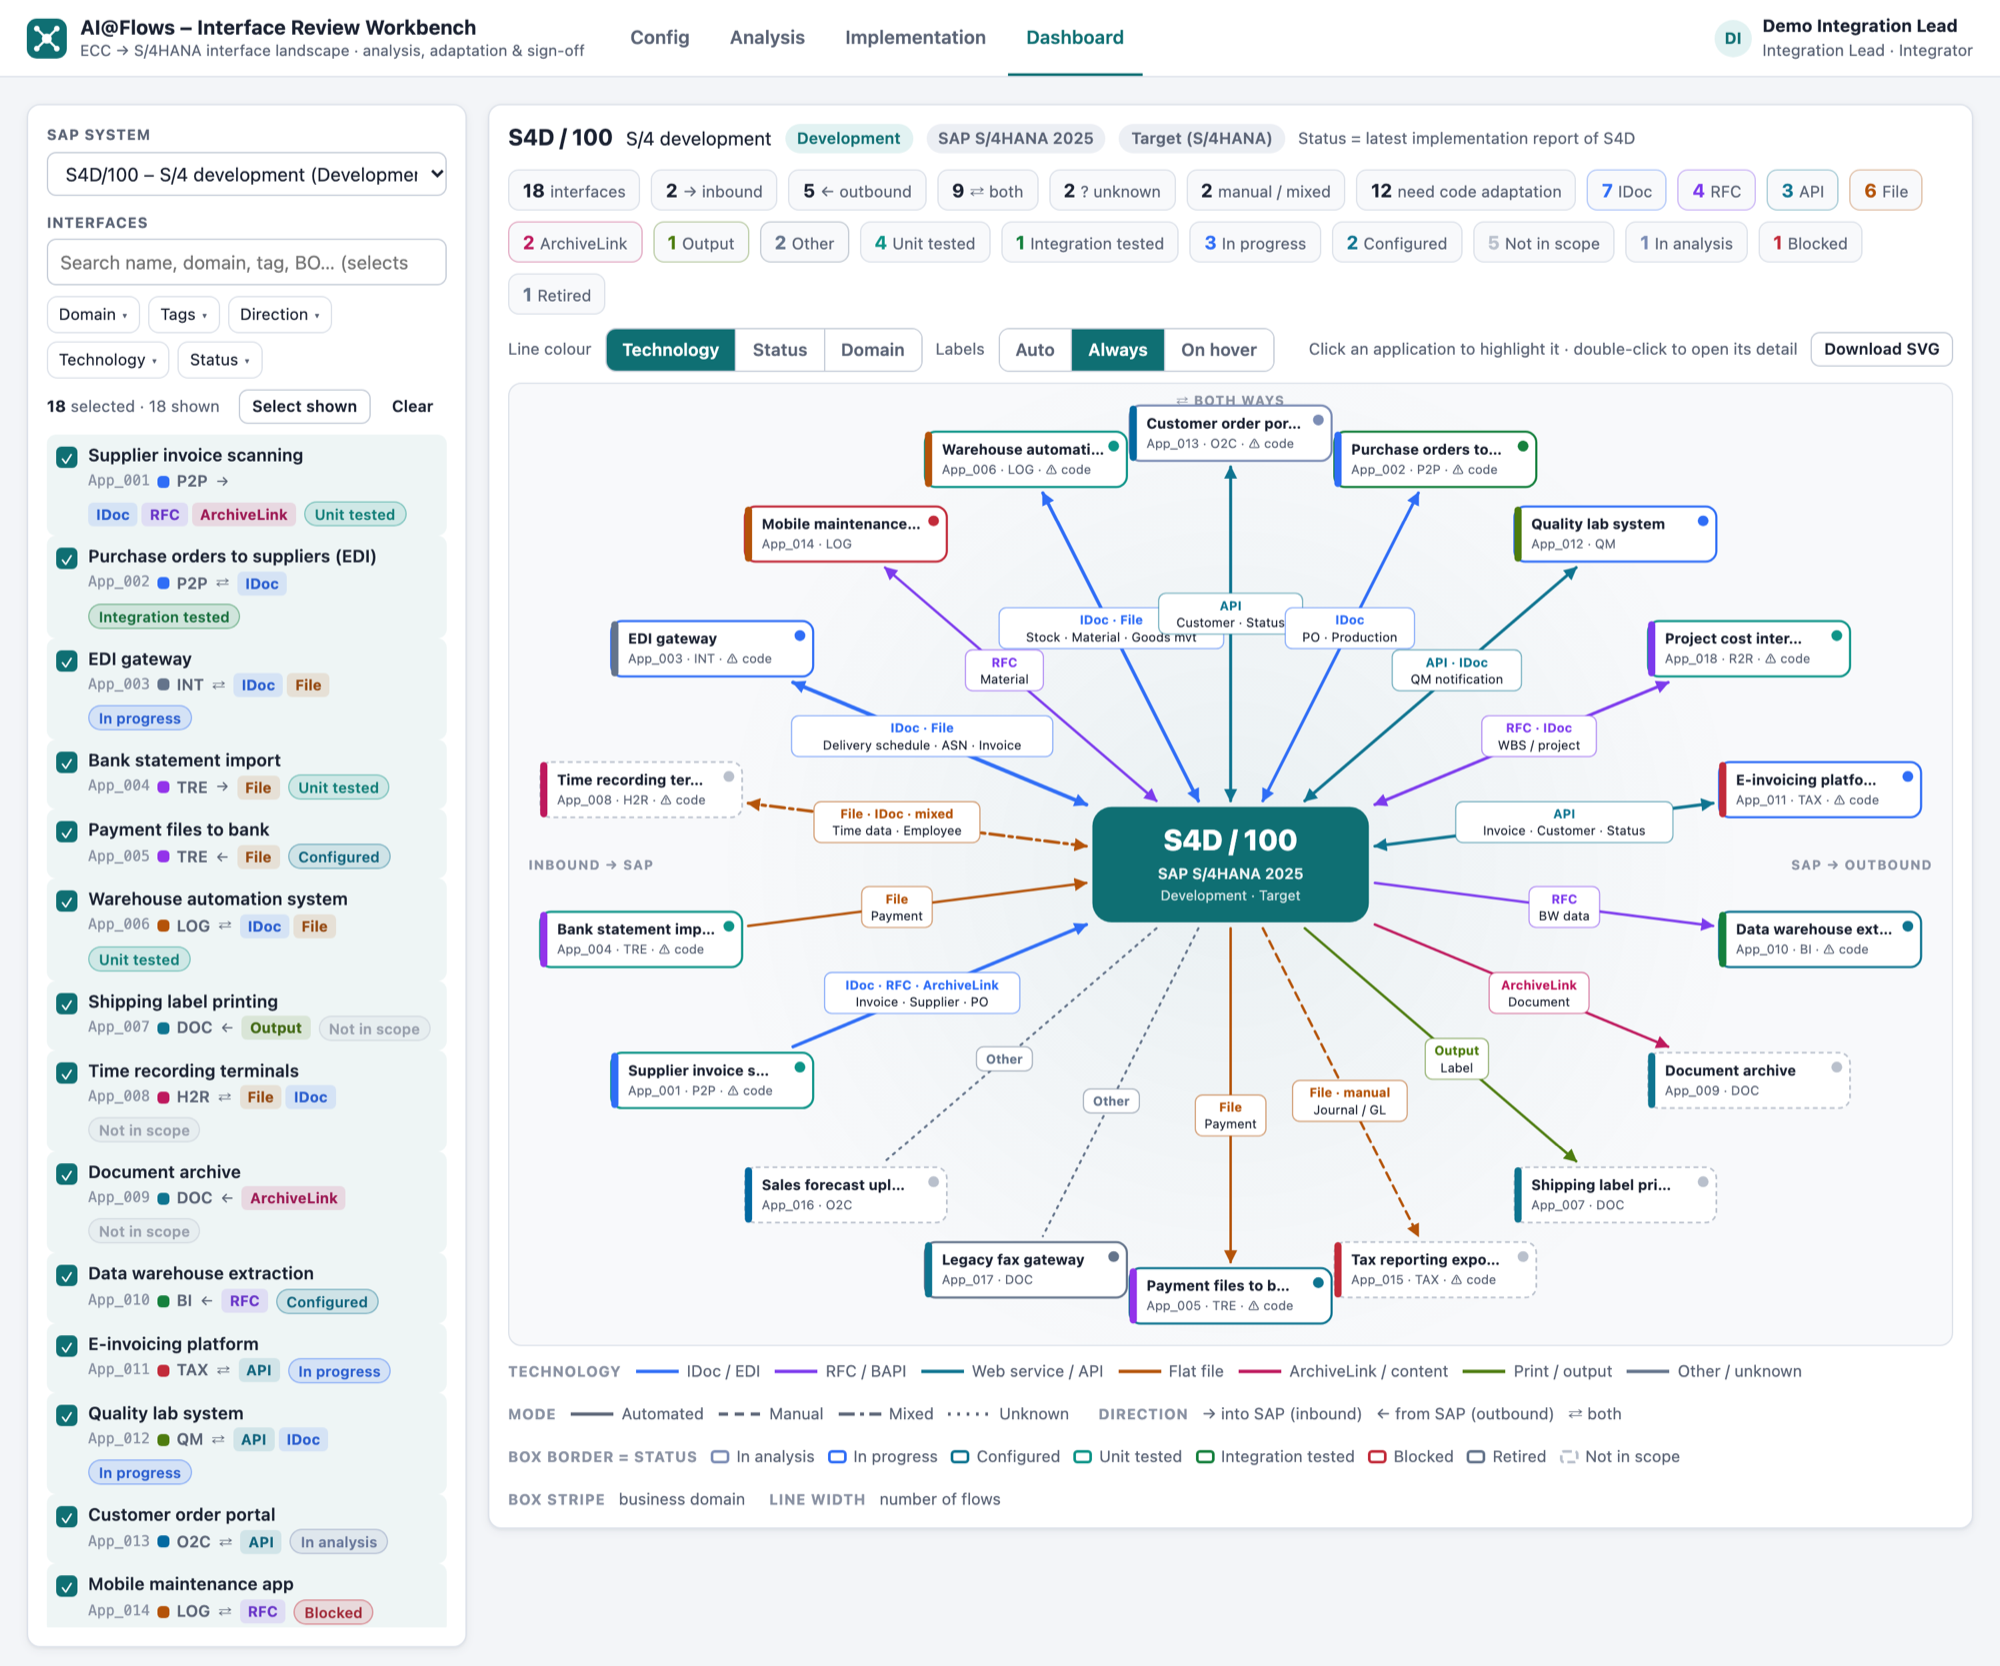
The Dashboard draws the interfaces of one SAP system as an application diagram: the system in the centre, one box per application, arrows for the direction, line colours for technology, status or domain, dashed lines for manual flows and the business objects on each link. Download it as SVG for workshops and architecture documents.
Architecture Overview
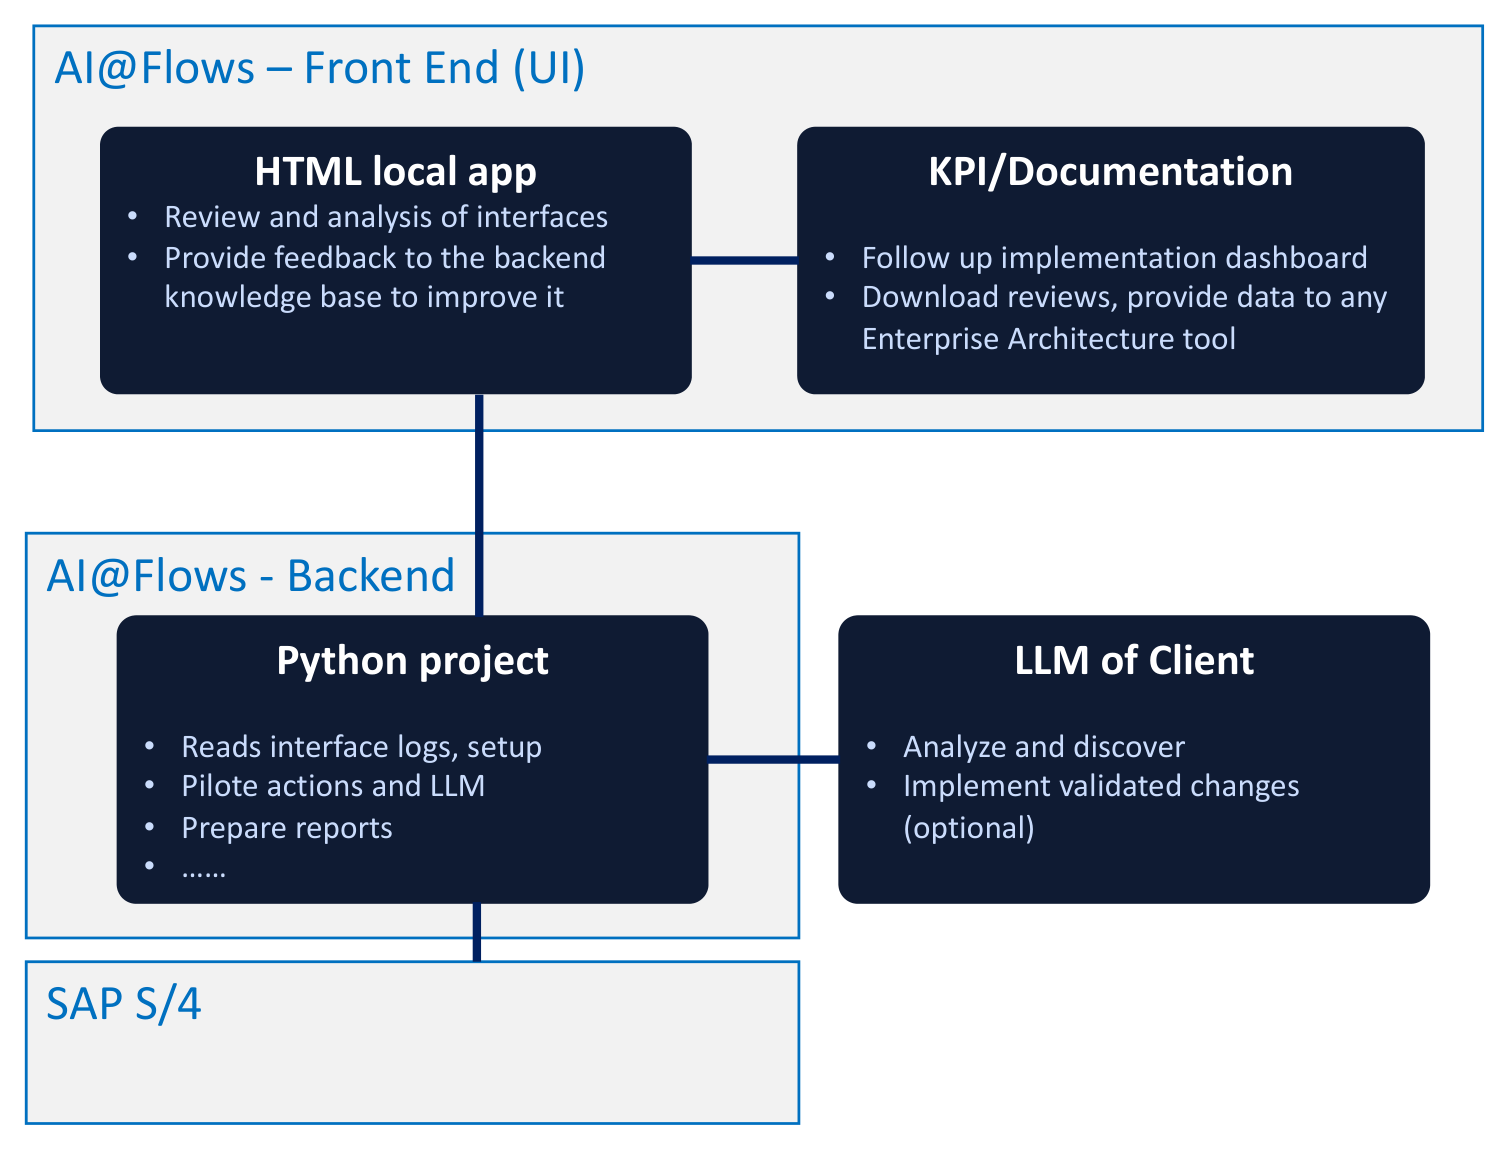
AI@Flows has two parts that only exchange report and review files:
- Front end — the Interface Review Workbench, a local HTML app, for the review and analysis of the interfaces. The review comments entered there are the feedback that improves the backend knowledge base. Its KPI and documentation functions follow the implementation on the dashboard, download the reviews and provide the data to any Enterprise Architecture tool.
- Back end — a Python project that reads the interface logs and set-up from SAP, pilots the actions and the LLM, and prepares the reports. The LLM runs in the client's own environment: it analyses the system, discovers the interfaces and, optionally, implements validated changes.
The front end has no connection to SAP or to the LLM: it only reads the reports and writes the review files described below.
Where the Data Lives
The HTML file contains no project or customer data. All data is read from three folders, typically in a SharePoint library synced with OneDrive:
| Folder | Content | Access |
|---|---|---|
| Interface Analysis reports | Interface analysis files (JSON), one per analysed system | Read |
| Interface Implementation reports | One report (JSON) per target system and cycle | Read |
| Review output | Review comment files and AI resolution files; shared settings and sign-offs in the _config subfolder | Read and write |
Because settings and sign-offs are saved in the shared Review output folder, everyone who opens the workbench on the same folders sees the same systems, tags, domains, assignments and sign-offs. File formats are described in Data Files (Admin).
Getting Started
1 — Open the File
Open Interface_Review_Workbench.html in Microsoft Edge or Google Chrome (double-click it or drag it into the browser window).
The workbench reads and writes folders with a browser feature that only Edge and Chrome provide. In other browsers the app shows a Limited browser notice: folders are read-only, and saved files are downloaded instead of written to the Review output folder.
2 — Select the Folders
On the Config page, section 1 · Report folders, click Select folder for the Interface Analysis reports, the Interface Implementation reports and the Review output folder, and allow the browser to access them. The browser remembers the folders; when you open the file again, click Reconnect folders if asked. Use ↻ Rescan folders after new reports are added.
3 — Sign In
In Config › 2 · Reviewer sign-in, choose your name, enter your PIN and click Sign in. You can browse every page without signing in; signing in is needed to add review comments, assign domains and tags, change the shared settings and sign off.
Until a reviewer list is saved, the app uses built-in demo reviewers. An administrator should replace them in Config › 6 · Reviewer administration before real use.
The Pages of the Workbench
| Page | What you do there |
|---|---|
| ⚙️ Config | Select the folders, sign in, maintain SAP systems, tags, business domains and reviewers |
| 🔎 Analysis | Switch between analysed systems, browse and filter the interfaces, open the full analysis, review custom code, add review comments, export to CSV |
| 🛠️ Implementation | Follow each interface across the target systems, read the report of each system and cycle, add review comments and sign off |
| 🗺️ Dashboard | Draw the application diagram of one SAP system and download it as SVG |
Who Uses It
| Role | Typical use |
|---|---|
| Integration Lead | Tracks implementation status per system, checks the configuration trace, comments, signs off interfaces |
| Functional Lead | Reviews business rules and test results, assigns business domains, comments, signs off interfaces |
| Application owners | Check and correct the analysis of their interfaces with review comments |
| Developers | See which used objects carry ATC findings |
| Project management | Use the KPIs, the landscape matrix and the CSV export for status reporting |