🗺️ AI@Flows Dashboard
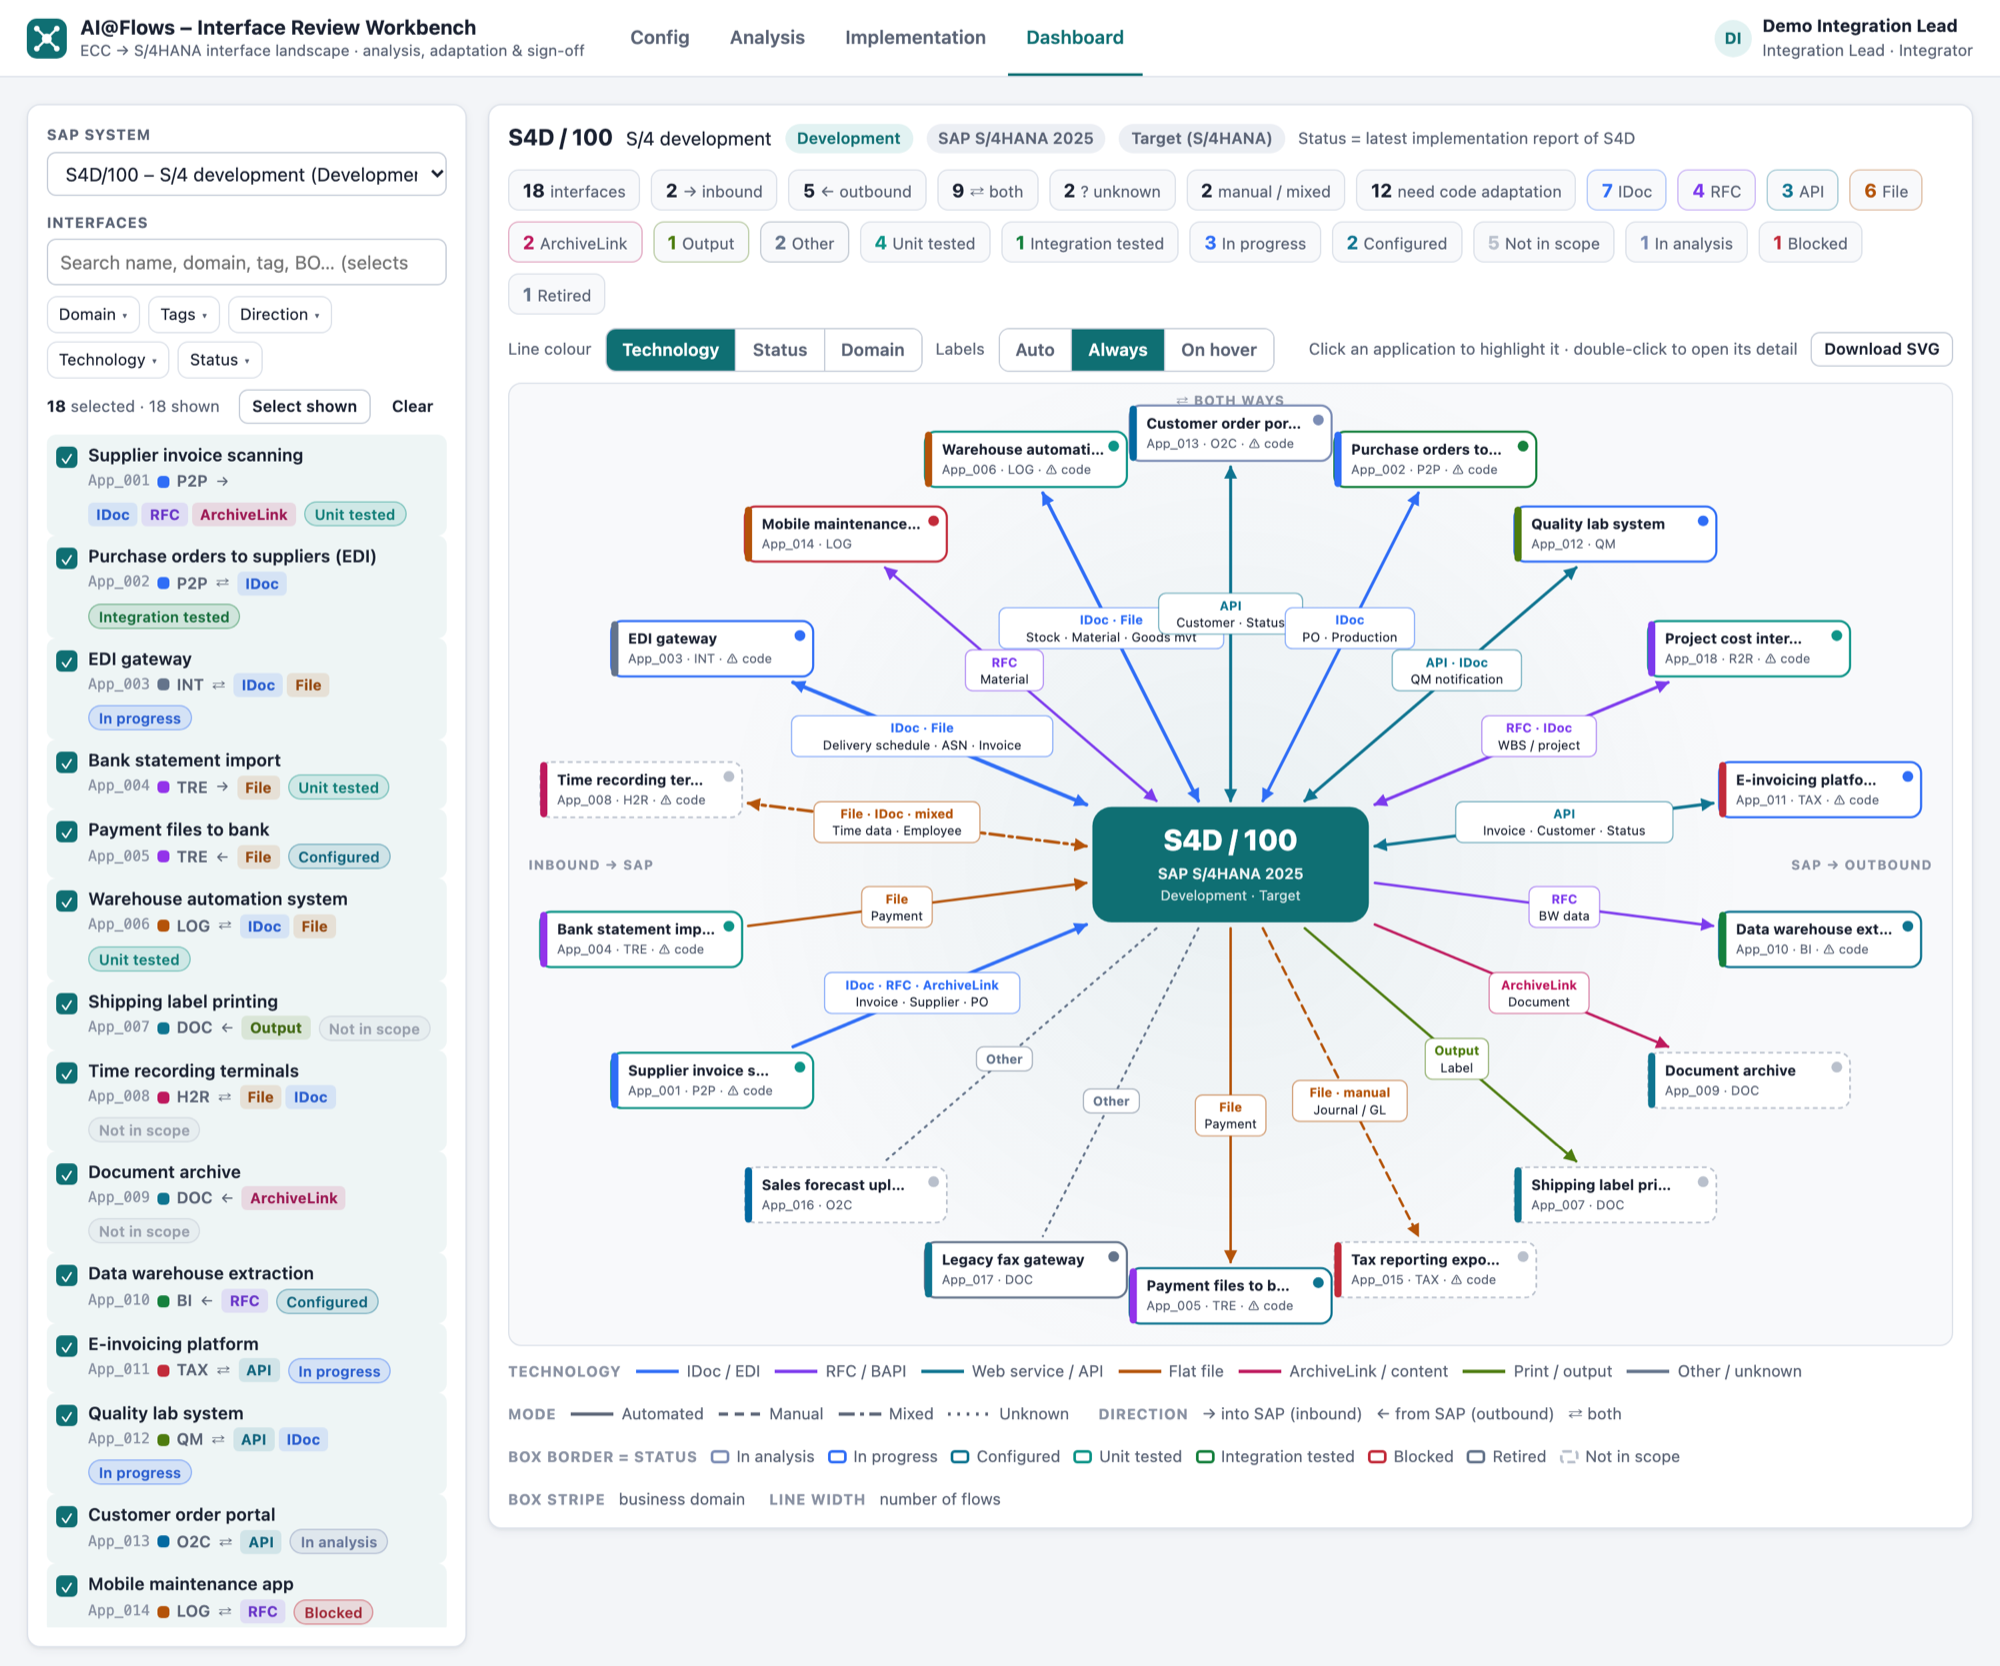
The Dashboard draws the application diagram of one SAP system: the system in the centre, one box per connected application, and one link per interface. Use it in workshops, status meetings or architecture documents.
1 — Choose a SAP system
Select the system in SAP system (left panel). The list comes from Config › SAP systems, source first, then targets by tier.
The header above the diagram shows the SID and client, name, tier, product and landscape, and where the status comes from:
- for the source system: the evidence found in the analysis
- for a target system: the latest implementation report of that system (interfaces without a report show as Not in scope)
Mini-KPIs summarise the selection: number of interfaces, inbound / outbound / both, manual or mixed, interfaces that need code adaptation, and counts per technology and status.
2 — Select interfaces
Type in Interfaces to search. The search is fuzzy and works on names, domain codes and tags: typing a domain code such as P2P, a tag, or part of an application name selects all matching interfaces. If more interfaces mention the text only in their details, a link offers to include them too (+ n more interface(s) mention …); Search names, domains and tags only switches back.
Narrow the list with the Domain, Tags, Direction, Technology and Status filters, then:
| Button | Effect |
|---|---|
| Select shown | Select all interfaces in the list |
| Clear | Deselect all |
| Reset | Reset search and filters |
You can also tick and untick single interfaces in the list.
3 — Read the diagram
| Element | Meaning |
|---|---|
| Centre | The selected SAP system |
| Box | An application (interface). The border colour is the status; the stripe is the business domain |
| Arrow | Direction: → into SAP (inbound), ← from SAP (outbound), ⇄ both |
| Line colour | Technology (default), status or domain, set with Line colour |
| Line style | Solid = automated · dashed = manual · dash-dot = mixed · dotted = unknown |
| Line width | Number of flows |
| Label on the link | The business objects exchanged (e.g. PO, GR, INV) |
Labels controls when link labels are shown: Auto, Always or On hover. A legend below the diagram explains the colours in use.
4 — Interact
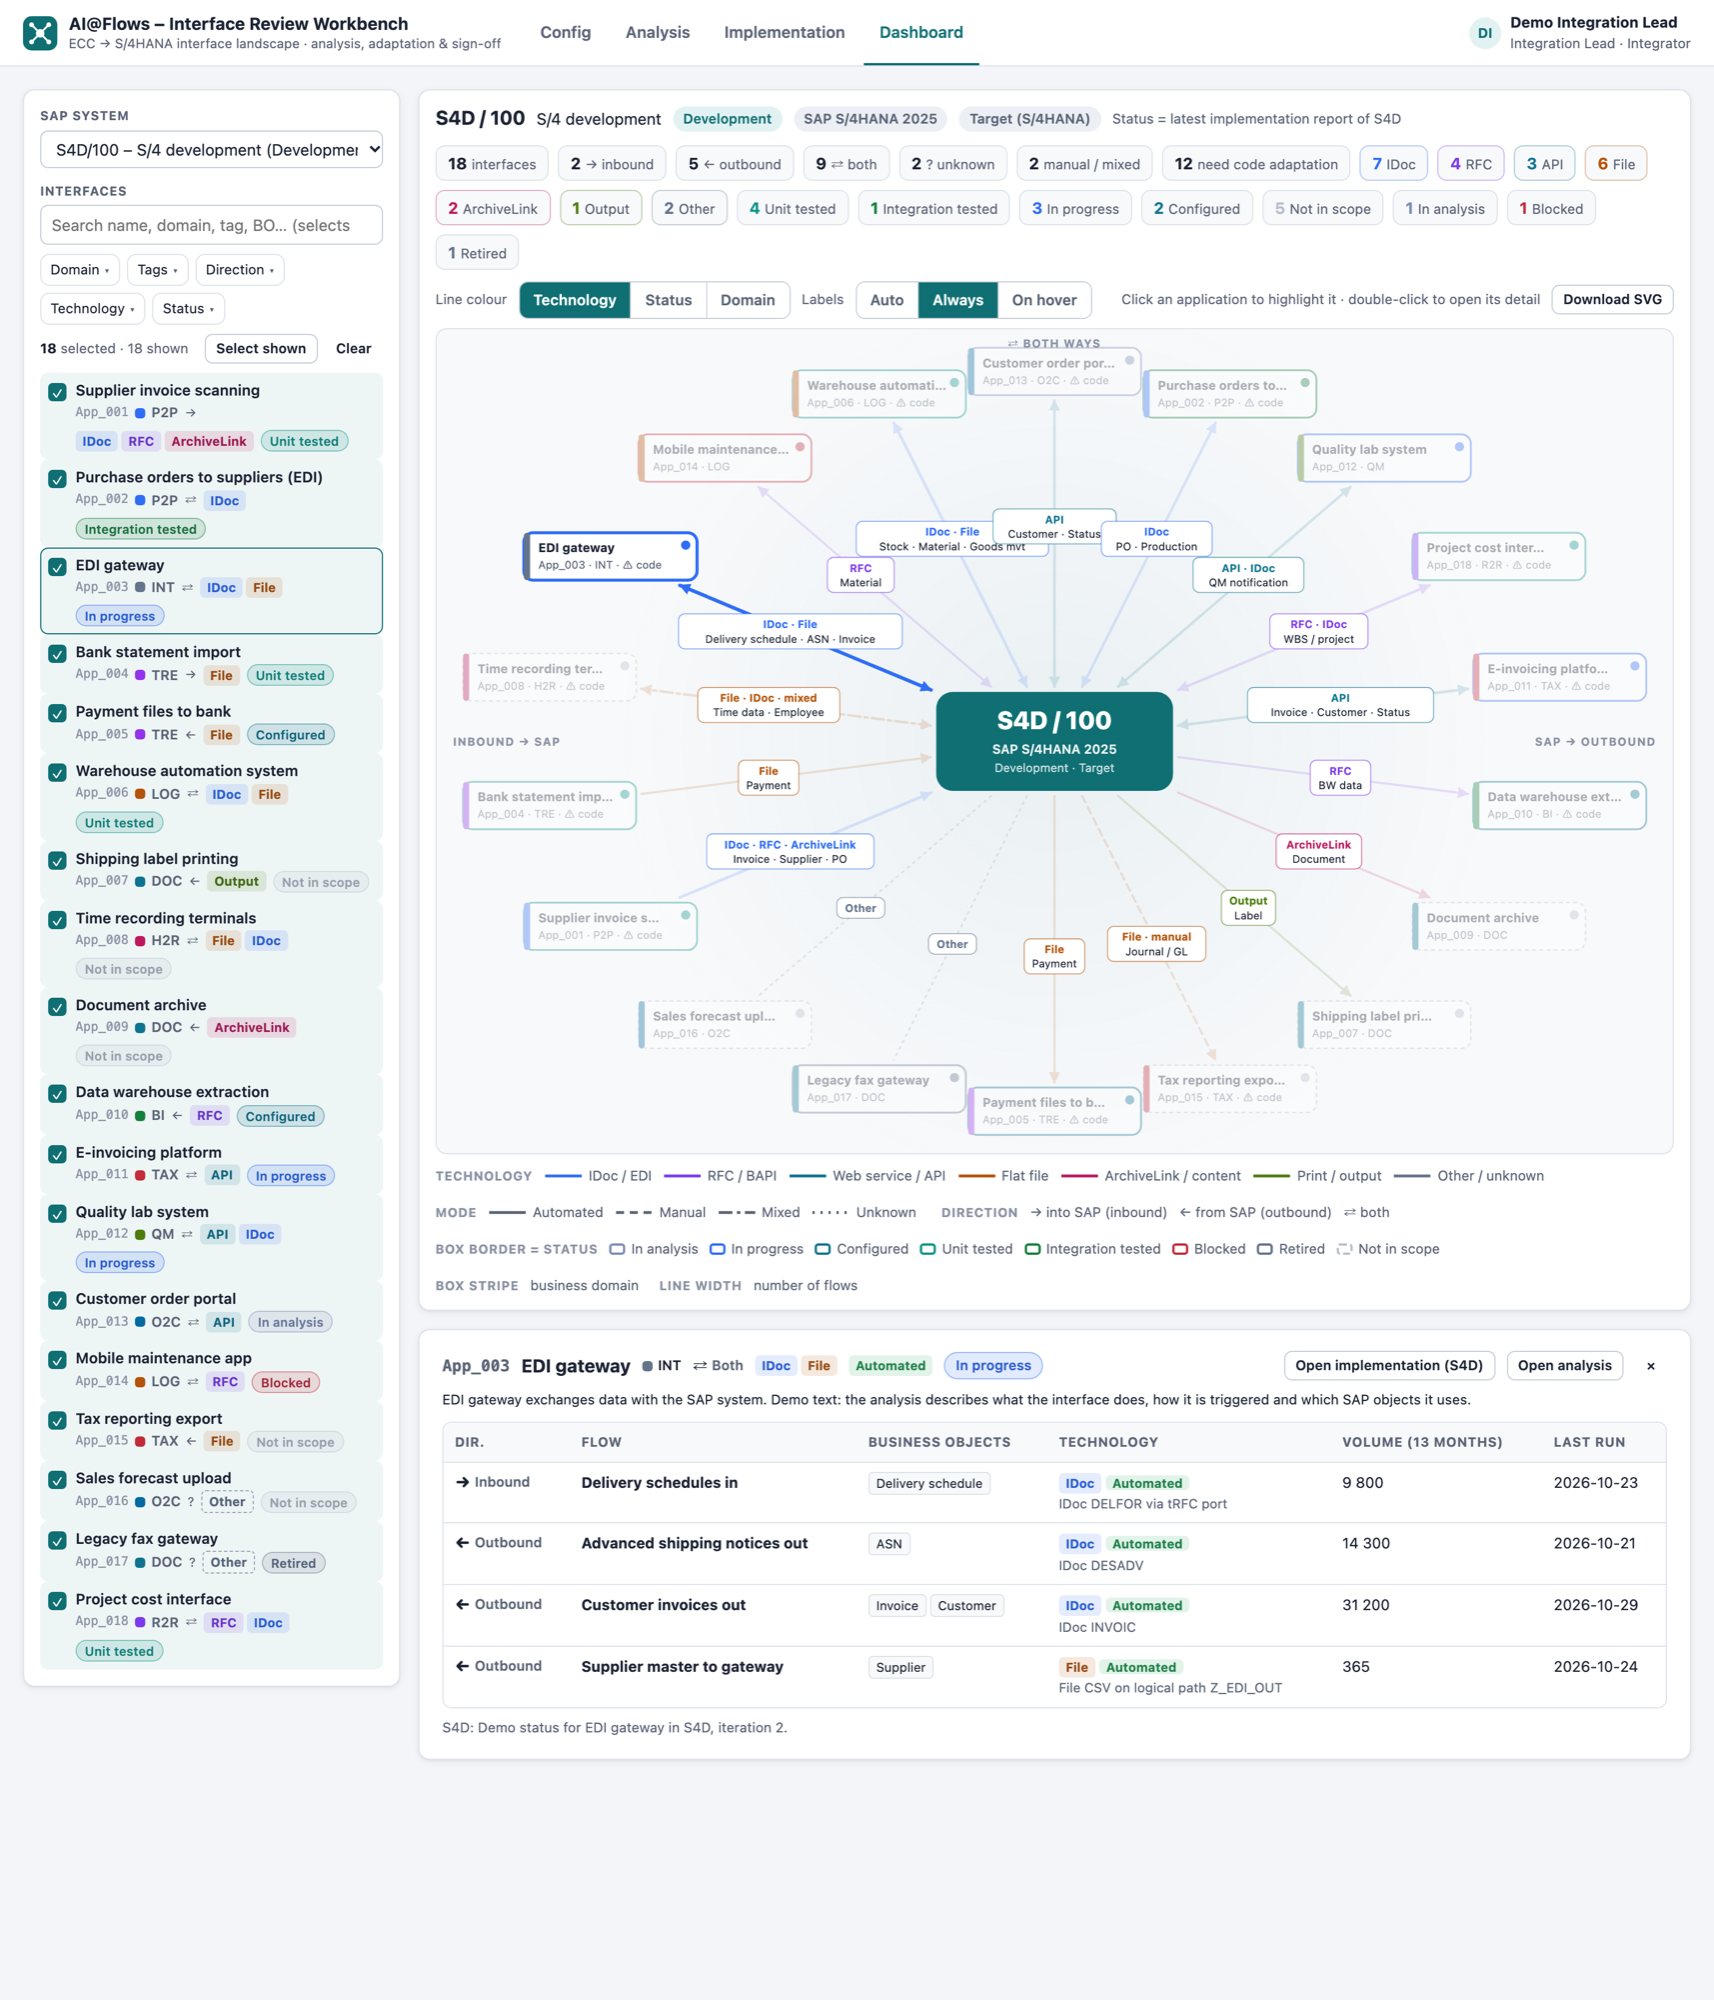
- Click an application box to highlight it and open its flow card below the diagram: direction, technology, mode and status, and per flow the business objects, technology and volume over 13 months. Open implementation and Open analysis jump to the interface on those pages.
- Double-click a box (or a row in the list) to open the interface detail on the Analysis page. The detail then shows Back to dashboard, which returns to the same system, selection and diagram.
5 — Export
Click Download SVG to save the diagram as a scalable vector image that you can insert in PowerPoint, Word or Visio without loss of quality.